
Investing 201: What if? Investment Returns and Risk
I recently watched “Free Solo,” a documentary about rock climber Alex Honnold, and his ascent of the very challenging 3,000 foot wall, el Capitan. He climbed the wall in under 4 hours, without a rope. Sheer granite, sheer exposure, sheer composure, sheer… WTF??!!! The risk seems impossibly great. To nearly any sane person, the potential return is insignificant compared to the risk. That is what makes the story so compelling.
There is no easy financial analogy to Honnold’s phenomenal accomplishment. In the investing world, risk and reward are partnered – they crawl, walk, dance or climb in tandem. As an investor reaches for greater returns, he/she is accepting a higher degree of risk. But, where’s the balance? How much risk do you need? How much return? This post in an exploration of the interplay between the two. I go pretty deep into the weeds, hence its “200-level” course title. If you are short on time, I wouldn’t judge you for stopping at the 8 word version (vs. all 3,124 words of the full post):
8-word summary of this post: There’s no such thing as a free lunch.
The other posts in the series are:
Investing 101 – Why invest? Create a process and a plan
Investing 102 – When? Use your emotions to fuel your why, and when you need the money temper them
Investing 103 – What? What should you invest in?
Investing 201 – What if? Risk and return in the stock market. What is right for you? (this post)
Investing 202 – Diversification and fees. Why do they matter? (future blog post).
Investing 301 – How? Create a comprehensive investing strategy. (future blog post).
Another story – Big Returns, with hidden risk
On another side of the risk-return spectrum are stories of people who pursue huge rewards, but ignore much quieter risks: young athletes and their families. More often than I’d like, I hear parents justify under-funding their kids’ college savings with an uncertain, and unlikely, future return.
“Who knows, maybe Johnny will earn a scholarship? What would I do with my 529 plan then?” (In actual fact, 529 college savings can be withdrawn without penalty if the student earns a scholarship).
This “big reward” thinking can seem to justify under-preparation today. Well meaning parents and adolescents can fall victim. Could this thinking be the subconscious rationale that allures many young people to shoot hoops, skateboard, or play video games rather than hit the books? I think so. If I had a nickel for the number of times that a video-game enslaved high schooler has told me about the “Pro video gamers earning six-figure incomes,” I’d be able to buy… well probably a good cup of coffee. Thankfully, I don’t see THAT many teenage video game slaves.
But, the truth is that the odds of a good-paying, meaningful job as a result of a college degree, or skilled trade education, are astronomically higher than the odds of going pro in athletics or video gaming. I’m not here to dispute the reward and allure of a scholarship, or a pro career. I’m just here to point out the hidden risks. Here is some data about the likelihood of a young person to earn an athletic scholarship or to go pro (source [1]):
- Only 2% of college students attend university on an athletic scholarship.
- Baseball has the highest chance for an athlete to go pro. Of high school baseball players, 0.6% go pro.
- In football, only 0.08% of high school players go pro.
- In basketball, only 0.03% of high school players go on to play in the NBA.
Adolescents are not known for their ability to navigate risk assessments. This is the job of parents. Every kid should have a plan, and a back-up plan.
Return from investments
What ARE investment returns? How do they work? Investment returns from stocks (and the funds that hold them) essentially come from two basic sources:
- Dividends – a cash payout that a company pays to its shareholders (owners of the stock)
- Stock price changes – the stock price can increase over time as a company sells more products, becomes more profitable, buys its own stock back, or if the company’s future prospects become more highly regarded by the market. Of course, the opposite can occur.
Investment returns from bonds come from two similar sources:
- Interest – a bond is a loan that you own, so the issuer of the bond pays you interest. For example, the US government routinely issues bonds to help pay to run the government (have you heard about the US deficit?). If you bought the bond (AKA US Treasuries), the US government pays you some interest each month or so, in addition to agreeing to return the face value of the bond after some period of time.
- Capital appreciation – a bond price can also change over time. One example: A bond paying 3% interest today will become less valuable (it’s price will drop) if interest rates rise because there will be new bonds available to investors that pay better. Who wants the bond paying less? Supply and demand makes the lower-paying bond worth less over time.
Although past returns should not be used to predict future performance, it is still illustrative to compare the investment returns of various types of investments over time. As Mark Twain supposedly said, “History does not repeat itself, but it often rhymes…” The figure below shows the long-term performance (1926 to 2017) of various markets. Notice that the top two lines are US small companies, and US large companies. The lower lines are US government bonds and inflation.

Long-term performance of various markets. Graphic courtesy of Dimensional Fund Advisors. Important disclosures are described in Reference [2].
What is the take-away?
Investing in the stock market has performed well over time, and much better than bond market investing. In the graphic above, a $1 investment into US small caps in 1926 would have turned into $22,985 by 2017 (an annual 11.8% return). However, if that same $1 was put into US short-term Treasury bills, it would have turned into only $21 by the year 2017 (an annual 3.4% return), barely beating inflation. In a more typical lifespan (say 50 years) a $1 investment in 1926 would have, 50 years later, become about $100.
The other thing that I find interesting is how relatively steady the growth is over long periods of time. Thus, for money that has a long-term time frame, I think that equity markets (stocks) offer one of the best opportunities to increase one’s wealth, and fund a future life.
Although data is useful to confirm a hunch or a theory, I always want to go a little bit deeper, and ask, “Is there a reason that stock markets should perform well over time?” I think that answer has a resounding “yes.” Here is why:
- Stock markets are actually baskets of individual companies like Apple, Toyota motors, Starbucks, or StitchFix. Those companies are run by smart people who are interested in making great and useful products, as well as earning profits.
- Companies have the power to raise prices. As their costs rise (with inflation), they can raise prices a little faster, keeping ahead of inflation
- If it is a good company, the leaders can leverage research, marketing, their brand and efficient operations to produce better and better revenues and profits over time.
Risk in investments
Risk is a trickier concept to define within investing. Technically, risk is defined as “variation away from the average result.” Zero risk means that the future is 100% known, and results will match what is expected. In a zero-risk environment, a $100 investment into US small caps would increase 11.8% to become $111.80 by year’s end (based on historical data). But investments don’t work that way. We know that the future return of the stock and bond markets will not be exactly what is predicted.
The part of risk that most people care about is, “will my investments lose money?” The unfortunate answer is “Yes, almost certainly,” But, the fortunate remainder of that sentence is, “but less often than they will gain.” The next figure illustrates my point:
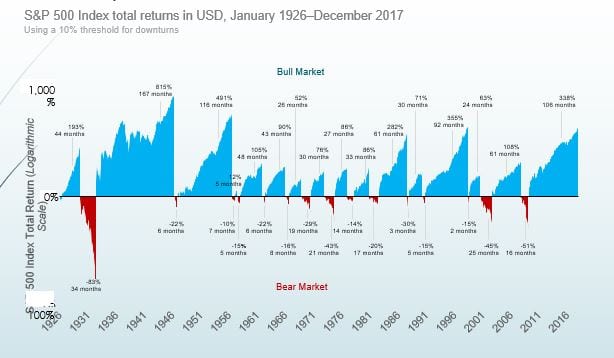
Image courtesy of Dimensional Fund Advisors. Important disclosures are included in reference [3]
This image shows how much time the US stock market has spent in rising territory (bull markets) vs. declining (or bear) markets. The blue is a bull market, while the red is a bear market. The US stock market has spent more time rising than falling. If you, as an investor, can weather the inherent ups and downs, then you stand a better-than-zero chance that your portfolio will grow more in value than fall. An important caveat is that forecasting when and how far the drops or surges is an impossible task to get right. The best advice then is don’t try to guess, just keep your long-term money invested. There is a saying in the investing world about how to get your investments to perform well:
“It is time in the market, not timing the market,” that will lead to strong portfolio performance. I agree.
Time of recovery as another way to consider risk
Another way to consider risk is to look at “time of recovery.” Since most people worry most about losing money in the markets, it can be useful to consider how long it takes for an investment to recover its value. Over the last 100 years, the US stock market has suffered several major losses. But, it has recovered from each loss in less than 4 years, except for two notable exceptions. Examples:
- In 1929, during the Great Depression, it took eight years for the stock market to recover. However, it did re-collapse, and it wasn’t until 1944 that the market recovered to pre-1929 levels.
- In the dot-com bubble (2000-01), the stock market crashed, and it took seven years to recover.
- In the “great recession” of 2008, the stock market dropped by about 50%. But, it had recovered within two years.
For a more interesting analysis, and detailed exploration, Matt Egan wrote a piece for CNN Money, where he calculated recovery times if the investor just kept putting money into the market ($1,000 bucks just before a crash, then $1,000 each year thereafter). This situation more accurately describes an unlucky, but disciplined investor. See source [4] for the original post. Some of the results of his exploration:
- Great Depression. The investor would have recovered his/her original investment within 7 years.
- Dot-com crash. The investor would have recovered his/her original investment within 5 years.
- Great Recession. The investor would have recovered his/her original investment in less than 2 years.
Take-away
If your time-frame is long, you will likely still come out ahead, especially if you contribute regularly towards your long-term goals.
Return and Risk example for stocks vs. bonds
It’s time for an example, with some real numbers, to help illustrate the differences between a stock investment and a bond investment. The following example uses fairly typical historical return/risk data for stocks and bonds. And I must point out once again, the inappropriateness of using historical data to predict future performance. I am using it to understand historical return and risk data. Suppose you invested $100 into two different investments:
- Stock fund, where the expected return is 10%, with a high risk (standard deviation of 15%).
- Bond fund, where the expected return is 4%, with much lower risk (standard deviation of 5%).
Example returns
The expected one-year return of $100 invested in each would be:
- Stock fund: +$10
- Bond fund: +$4
Over 20 years, if the “expected return” was earned and reinvested each year, the final balance would be:
- Stock fund: $673
- Bond fund: $219
Example risk
The risk of the investments is described by probabilities. The thing about risk though, is that very few people think in terms of probability. Rather, people think in terms of “Am I going to lose money?” So, when I speak to a client who would be thinking about investing $100, I would ask, “What would you do if your investment lost $6? -$21? -$36? Are you willing to live with such drops in your portfolio over a few years? How would that affect your long-term plans?”
For completeness in this post, here are the calculated probabilities of different returns based on the standard deviations of the stock and bond funds. (See note [5] for details about the math).
| Investment | 67% of future returns | 75% of future returns | 89% of future returns |
| Stock fund | between -6% and +25% | between -21% and +40% | between -36% and +56% |
| Bond fund | between -1% and +9% | between -6% and +14% | between -11% and +19% |
I think the risk that makes sense to people is: If the market crashed badly (a 10% chance), then $100 invested in a stock fund would drop to $64 in a year, while the bond fund would drop to $89. Can you sleep at night with either level of risk?
Why are stock and bond prices volatile?
At the risk of losing whatever readers have stuck with this post, I think it is useful to consider the mechanics of risk in bonds and stocks. I will start with bonds. Although the interest rate and term for most bonds is fixed, the price can change as interest rates change. If interest rates rise, a current bond becomes less desired as compared to new bonds. Would you rather own a bond that pays 3% or 4%? When rates rise, current bond prices tend to fall. But, the amount of the fall is predictable. A rule-of-thumb is to look at the “duration” of a bond, the time until a bond ends. If interest rates change by 1%, then the price of a bond will change by about 1% times the numbers of years of duration. Thus, if interest rates rose by 0.75% (as they did in 2017), a
- 2-year duration bond would fall in price by 1.5%.
- 10-year duration bond would fall in price by 7.5%.
- 30-year duration bond would fall in price by 20%.
Even though the price of the bond falls, the bond continues to pay a known interest (or coupon) payment. The overall bond’s return is a mix of both factors.
A stock’s (or stock fund’s) return is based on the dividend and stock price change. The dividend is less stable for stocks as compared to a bond’s interest payment – a company can choose to raise or lower its dividend whenever it desires, whereas a bond’s interest rate, or coupon is an obligation. The stock price is based on many fundamental economic factors like the companies’ profits, assets and debts. In addition, there is always a substantial element of “how much future potential does the market think this company has?” The latter can change quickly, and lead to rapid shifts in the stock price.
Take-away
A bond’s future returns are reasonably well known. Bonds are loans with a known interest rate and term. The only indeterminate feature of the bond’s return are future interest rates. However, the guiding governmental body of interest rates, the federal reserve, tries to make interest rate changes very transparent and predictable. The levers of a bond’s return are either calculated or carefully scripted. Thus, bonds are less volatile, or less risky. If we knew the outcome of a sporting contest before hand, there would be little excitement. That’s the bond market – like watching a rerun of the longest cricket match in history – a 14 day affair between England and South Africa in 1939.
Balancing risk and return
When you create a process and a plan for your investments, you must decide how much return you need for your investments, and how much risk you can handle, or are willing to handle. Different investments are on a continuum that looks like:

Conceptual drawing by John Chesbrough. Image is not drawn to scale.
Positioning a portfolio for higher returns also means your portfolio is exposed to a higher risk. Developing an appropriate asset allocation (the mix of stocks vs. bonds vs. cash) is a major facet of the financial planning process. When I do so for clients, I consider many factors including:
- Time-frame. Money needed within the next 1-3 years, or for a specific purpose within 5 years needs to be lower risk, higher liquidity.
- Your goals and dreams. Do you want a second home? Give significantly? Travel? Buy a boat? Retire early (or become financially free)?
- Your current financial assets. How well are they positioned to provide for your future goals/dreams?
- Your savings rate. How much are you savings towards your future goals?
- Your future income sources such as pensions, real estate, business interests.
I analyze your situation, and determine an asset allocation that yields enough return to meet your goals. Or, we talk about trade-offs if the current plan isn’t on track. But, other important considerations are:
- Your risk capacity. Are your current assets positioned to weather the inevitable declines in an investment portfolio?
- Your risk tolerance. Can you sleep at night with the current mix of risk and return?
Rules-of-thumb for stock vs. bonds
If you want a simple rule-of-thumb to create an asset allocation, start with “Subtract your age from 100. That is the percent you ‘should’ have in stocks.” The other percent might be in bonds, real estate or cash. So, if you are 40 years old, this rule would say you should have 60% in stocks, 40% in bonds. Personally, I find this rule too crude to trust your financial life to, but for do-it-yourselfers it is a good place to start. Better yet, many of the self-service brokerage services like Vanguard offer an online risk-tolerance/asset allocation guide.
A return to Ava and Raj thinking about risk and return
Throughout this series about investing, I have presented a story of Ava and Raj building an investment strategy and process for themselves.
Their story:
Ava and Raj are a married couple in their early 50s, with two daughters – Sonia just graduated from college, while Abby is going to start university next Fall. Raj works as an elementary school principal, and has a state pension. Ava is a nurse practitioner, and is opening her own practice. They have created goals, and organized their finances (see previous post for details of those).
Risk and return parameters
We determined that Ava and Raj need to achieve an average 4.5% annualized return in order to achieve their future goals. Although 4.5% is not an out-sized return goal when compared to the historical return of the US stock market, it still requires some risk in a portfolio. Through conversation and dialog, Ava and Raj decided that they are comfortable with a moderate amount of risk. They have a high risk capacity, because they save more than they spend, they will have future income sources including social security and Raj’s pension, plus they already have significant assets accumulated in 401k and 403b plans. Thus, I felt their risk tolerance decision was suitable. We identified different risk and return characteristics for their assets based on the time-frame for when they need the money.
| Time-frame | Expected Return | Risk Profile | Specific investment(s) |
| Short-term | Low (1-2%) | Low | Short-term T-bills (1-3 month duration) |
| Intermediate-term (needed within 5 years for a specific purpose) | Keep up with inflation (3-4%) | Low |
CD ladder and US Treasury Inflation-protected securities, or “TIPS” |
| Long-term | 7% | Moderate (10% standard deviation). They are willing to live with a 25% chance of return within -13% and +27%. |
Overall asset allocation: 60% stocks, 40% bonds |
The overall desired asset allocation for long-term money is shown below. See notes [6] and [7] for details about the math of calculating an expected return and standard deviation for multiple asset classes.

Sample asset allocation for 60% equity, 40% fixed income portfolio. Data courtesy of Right Capital, financial planning software.
Final thoughts
Wow, you are still reading this?? Thanks! It may have felt as though you were climbing El Capitan without a rope. Well, I am here to tell you that you can climb with a rope and a guide! That is essentially what we do at Trail Financial Planning. We act like guides throughout your financial journey. If you’d like to read more of this investment series, here are the chapters:
Investing 101 – Why invest? Have a process and a plan (previous post)
Investing 103 – What investments should you choose?
Investing 201 – What if? Investment Returns and Risk (this post)
Investing 202 – Diversification and fees. Why do they matter? (future blog post)
Investing 301 – How? Create a comprehensive investing strategy. (future blog post)
Or, you can read more about financial matters that matter from my main blog page. If you’d like to talk more about your specific situation, schedule a free consultation here.
Notes
[1] Here are the Odds that Your Kid Becomes a Professional Athlete (hint: they’re Small). Article author: Tony Manfred, Business Insider, Feb. 10, 2012. https://www.businessinsider.com/odds-college-athletes-become-professionals-2012-2
[2] Disclosure for “Capital Markets Have Rewarded Long-term Investors.” Figure courtesy of Dimensional Fund Advisors.
US Small Cap Index is the CRSP 6–10 Index; US Large Cap Index is the S&P 500 Index; Long-Term Government Bonds Index is 20-year US government bonds; Treasury Bills are One-Month US Treasury bills; 1-Month Treasury Bills Index is the IA SBBI US 30 Day TBill TR USD. Treasury Index data sourced from Ibbotson Associates, via Morningstar. Direct Inflation is the Consumer Price Index. CRSP data provided by the Center for Research in Security Prices, S&P data copyright 2018 S&P Dow Jones Indices LLC, a division of S&P Global. All rights reserved. Bonds, T-bills, and inflation data provided by Morningstar.
Past performance is no guarantee of future results. Indices are not available for direct investment. Their performance does not reflect the expenses associated with the management of an actual portfolio.
[3] Disclosure for “S&P 500 Total Returns…” Figure courtesy of Dimensional Fund Advisors.
[4] “Worried about a Stock Market Crash? Read this” Article author: Matt Egan, CNN Money, Feb. 26, 2015. https://money.cnn.com/2015/02/26/investing/stock-market-crash-bubble-investing/index.html
[5] Standard deviations are actually only relevant when a distribution is in the shape of a “normal distribution.” Market returns generally have not. However, a mathematician named Chebyshev developed a way to estimate the proportion of returns that fall within a given number of standard deviations, represented by k. The formula is (1-1/k2) for k greater than 1. Source: Evensky, Moran, Robinson, “The New Wealth Management – The Financial Advisor’s Guide to Managing and Investing Clint Assets.” CFA Institute Investment Series, 2011.
[6] The expected return of the portfolio is a weighted average calculation, found by summing up W*x where W is the %weight of the asset class and x is the expected return for the asset class. The specific expected returns and standard deviations used in this example are printed after this “Notes” section.
[7] Standard deviation of the asset allocation is an involved formula based upon the standard deviations of the underlying asset classes.
Risk and return assumptions of various asset classes. Data is from Right Capital. These numbers are based on historical data, and should not be assumed to predict future performance.

Asset class return and risk data used, current as of November 2018.